R&D Blog
Intermarket Analysis: The Pathfinder | Trading Strategy (Filter)
I. Trading Strategy
Developer: Nelson F. Freeburg. Concept: The currency trading strategy based on the intermarket analysis. Source: Freeburg, N. F. (Dec. 1993). Formula Research, Quantitative Treatment of the Financial Markets. Memphis, TN: Formula Research, Inc. Research Goal: Performance verification. General Description: The Pathfinder currency trading system uses the same model for trading four currency futures: Japanese Yen, Deutsche Mark (Euro), Swiss Franc, and British Pound. A confirmation of the trend in currencies comes from the Treasury Bond futures. Specification: Table 1. Results: Figure 1-2. Trade Setup: Long Trades: (i) Today’s 9-day moving average (MA) of the currency’s close crosses above today’s 18-day MA, and (ii) Today’s 6-day MA of the currency’s close is greater than the previous day’s 6-day MA. Short Trades: Short-side signals are the exact opposite of buy-side signals. Trade Filter: Long Trades: A buy setup for the currency model is valid only if today’s 3-day MA of the closing price of the T-bonds is greater than the 25-day MA. Short Trades: The short-side filter is the exact opposite of the buy-side filter. Trade Exit: Table 1. Portfolio: 4 futures markets (JY, EC, SF, BP). Data: 35 years since 1980. Testing Platform: MATLAB®.
II. Sensitivity Test
All 3-D charts are followed by 2-D contour charts for Profit Factor, Sharpe Ratio, Ulcer Performance Index, CAGR, Maximum Drawdown, Percent Profitable Trades, and Avg. Win / Avg. Loss Ratio. The final picture shows sensitivity of Equity Curve.
Tested Variables: Setup_Index & Filter_Index (Definitions in Table 1):
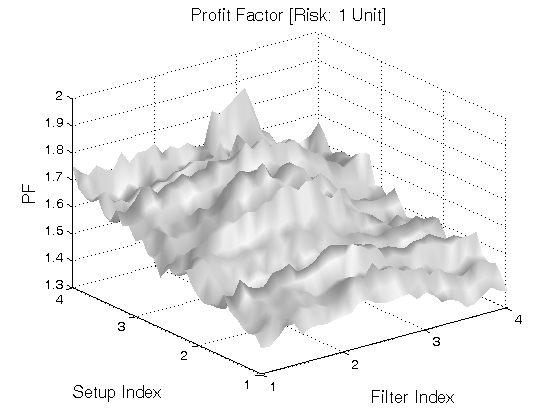

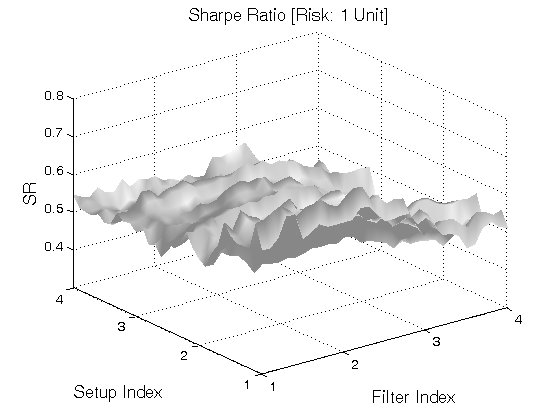

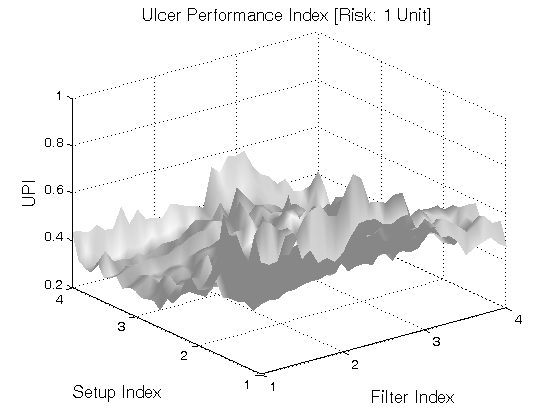
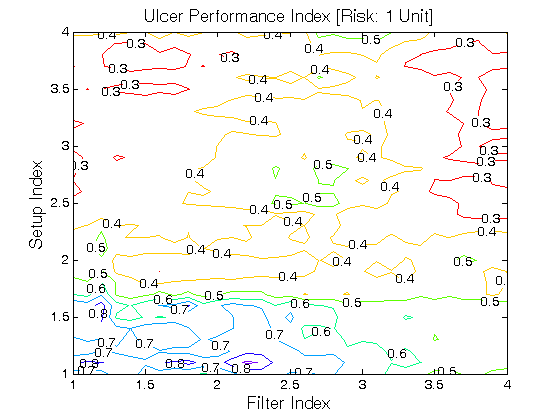

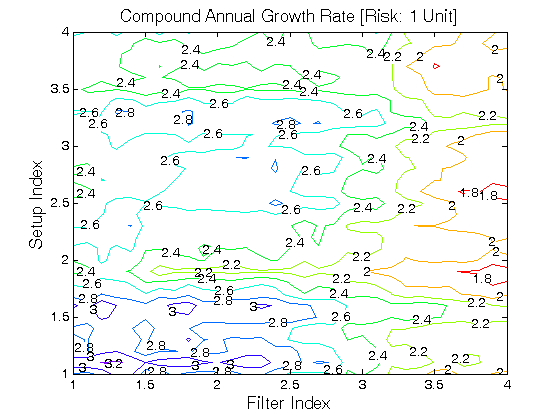

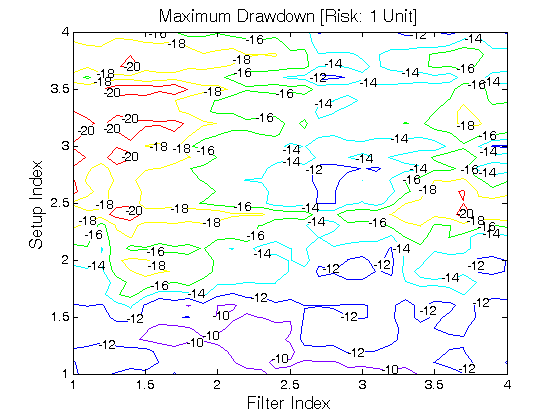
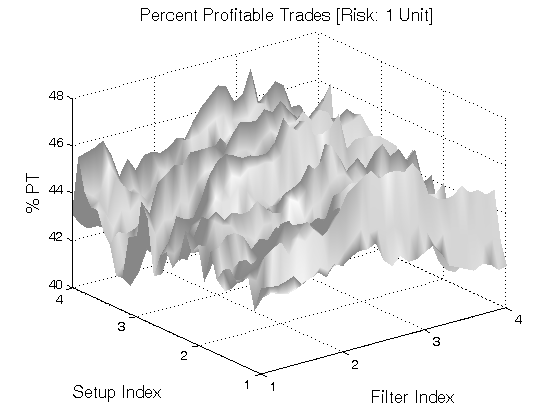
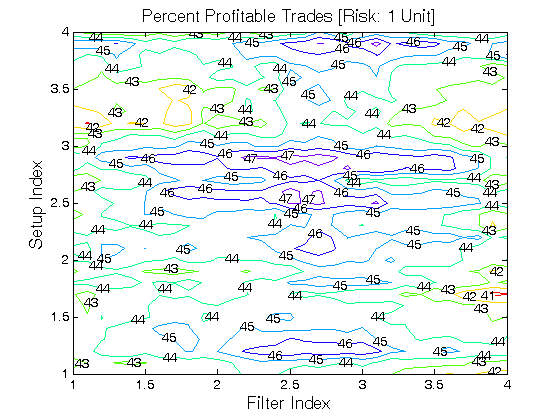
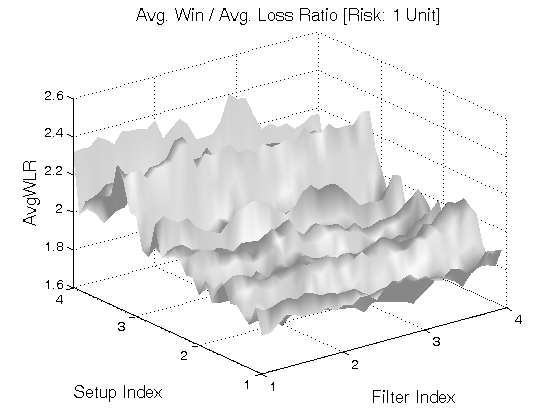
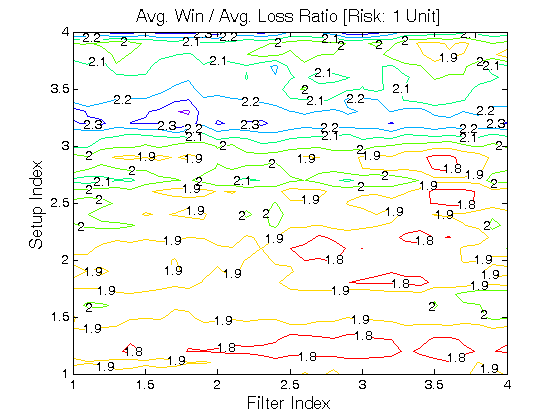
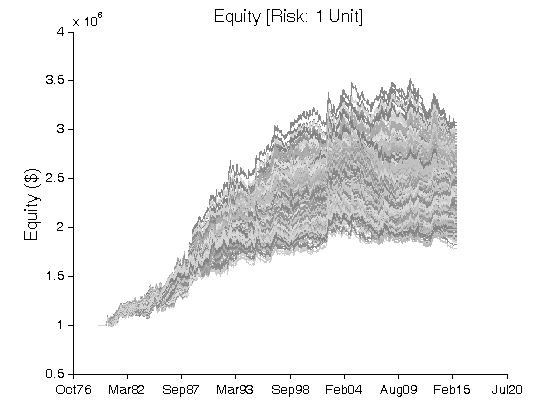
Figure 1 | Portfolio Performance (Inputs: Table 1; Commission & Slippage: $0).
| STRATEGY | SPECIFICATION | PARAMETERS |
| Auxiliary Variables: | Trade Setup (Currencies): MA1(Look_Back_Period_#1) is the simple moving average of the currency’s close price over a period of Look_Back_Period_#1. MA2(Look_Back_Period_#2) is the simple moving average of the currency’s close price over a period of Look_Back_Period_#2. MA3(Look_Back_Period_#3) is the simple moving average of the currency’s close price over a period of Look_Back_Period_#3. Trade Filter (T-bonds): MA4(Look_Back_Period_#4) is the simple moving average of the close price of the T-bonds over a period of Look_Back_Period_#4. MA5(Look_Back_Period_#5) is the simple moving average of the close price of the T-bonds over a period of Look_Back_Period_#5. Note: The Pathfinder trading system has the default parameters when Setup_Index = 1 and Filter_Index = 1 (Sensitivity Test). | Setup_Index = [1.0, 4.0], Step = 0.1; Filter_Index = [1.0, 4.0], Step = 0.1; Look_Back_Period_#1 = round(6×Setup_Index); Look_Back_Period_#2 = round(9×Setup_Index); Look_Back_Period_#3 = round(18×Setup_Index); Look_Back_Period_#4 = round(3×Filter_Index); Look_Back_Period_#5 = round(25×Filter_Index); |
| Setup: | Long Trades: (i) MA2[i] > MA3[i]; and (ii) MA1[i] > MA1[i – 1]. Short Trades: (i) MA2[i] < MA3[i]; and (ii) MA1[i] < MA1[i – 1]. Index: i ~ Current Bar. | |
| Filter: | Long Trades: MA4[i] > MA5[i]. Short Trades: MA4[i] < MA5[i]. Index: i ~ Current Bar. | |
| Entry: | Long Trades: A buy at the open is placed after a bullish signal (i.e. Setup & Filter). Short Trades: A sell at the open is placed after a bearish signal (i.e. Setup & Filter). | |
| Exit: | MA Exit: Long Trades: If (MA2[i] < MA3[i]) then close out the position on tomorrow’s open. Short Trades: If (MA2[i] > MA3[i]) then close out the position on tomorrow’s open. Index: i ~ Current Bar. Stop Loss Exit: ATR(ATR_Length) is the Average True Range over a period of ATR_Length. ATR_Stop is a multiple of ATR(ATR_Length). Long Trades: A sell stop is placed at [Entry − ATR(ATR_Length) * ATR_Stop]. Short Trades: A buy stop is placed at [Entry + ATR(ATR_Length) * ATR_Stop]. Stop Loss Exit is used to normalize risk via position sizing. | ATR_Length = 20; ATR_Stop = 6; |
| Sensitivity Test: | Setup_Index = [1.0, 4.0], Step = 0.1 Filter_Index = [1.0, 4.0], Step = 0.1 | |
| Position Sizing: | Initial_Capital = $1,000,000 Fixed_Fractional = 1% Portfolio = 4 US Futures (JY, EC, SF, BP) ATR_Stop = 6 (ATR ~ Average True Range) ATR_Length = 20 | |
| Data: | Four futures markets (JY, EC, SF, BP); 35 years (1980/01/01−2015/4/30). |
Table 1 | Specification of Trading Strategy.
III. Sensitivity Test with Commission & Slippage
Tested Variables: Setup_Index & Filter_Index (Definitions in Table 1):
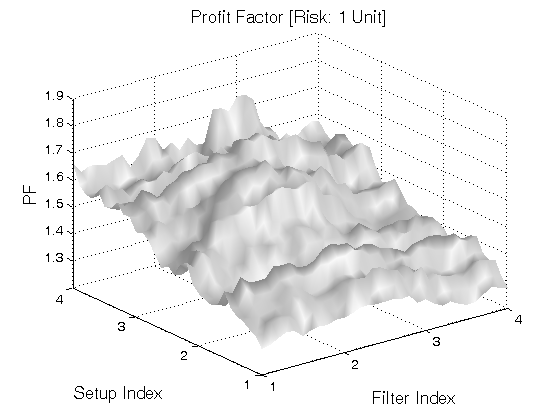
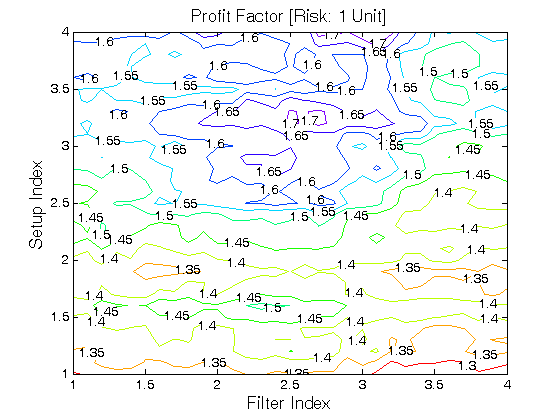
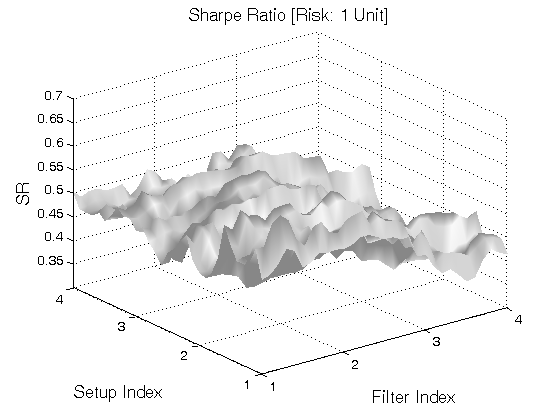
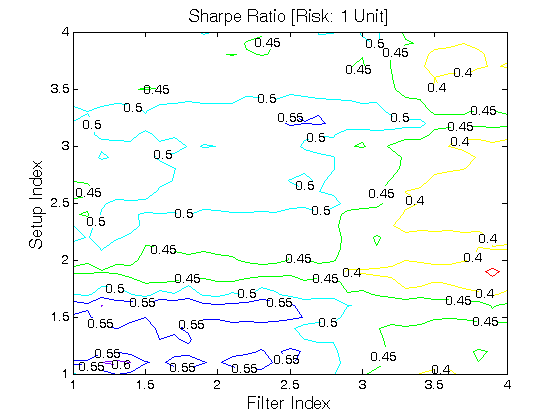
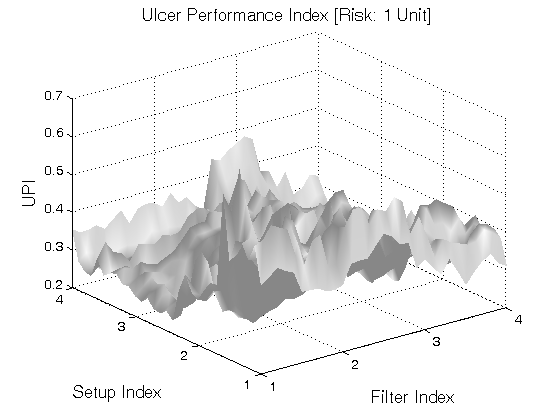
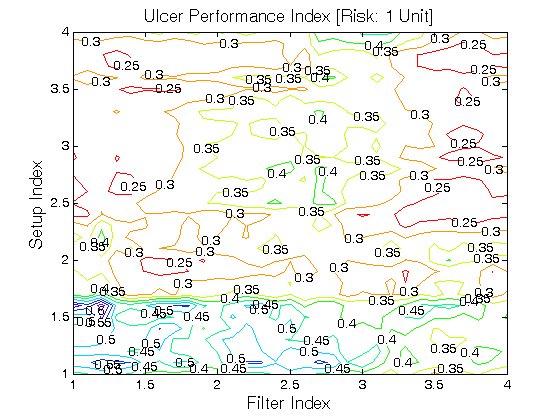
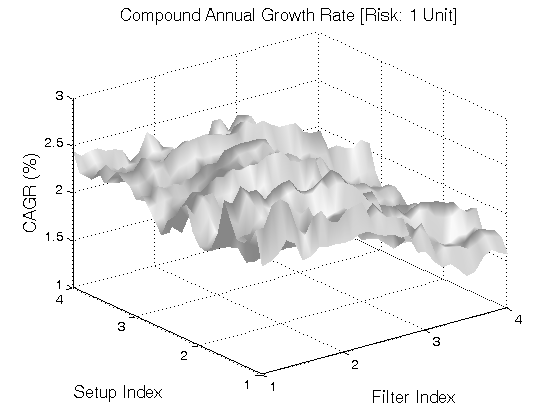
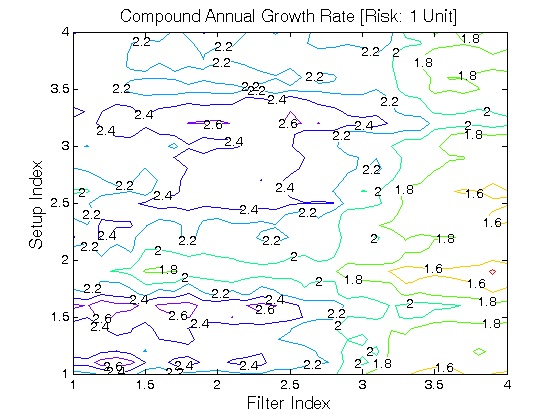
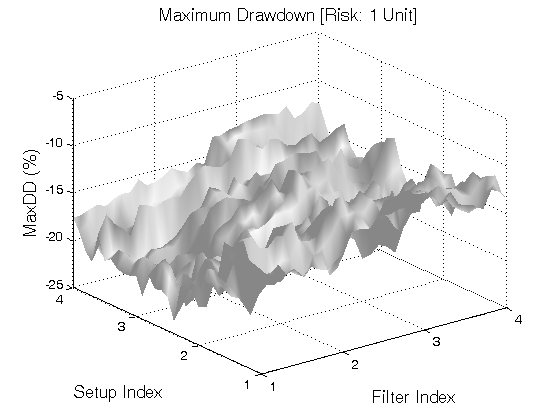
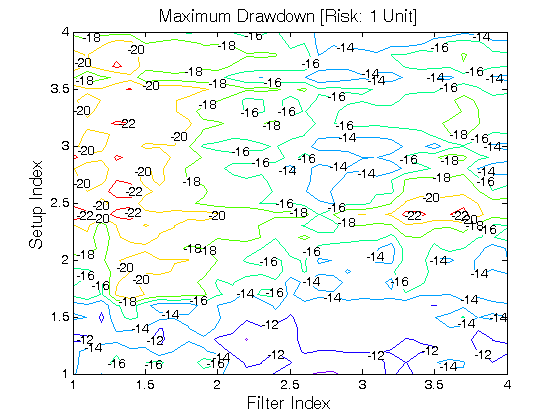

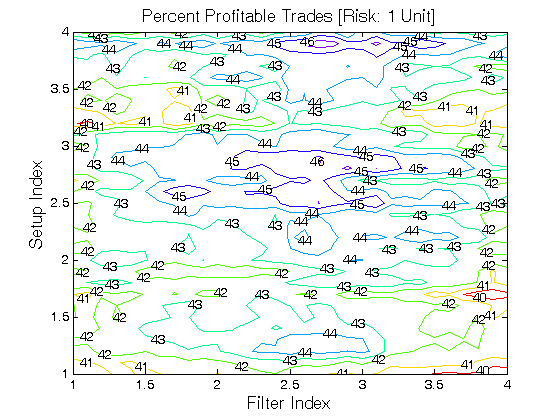
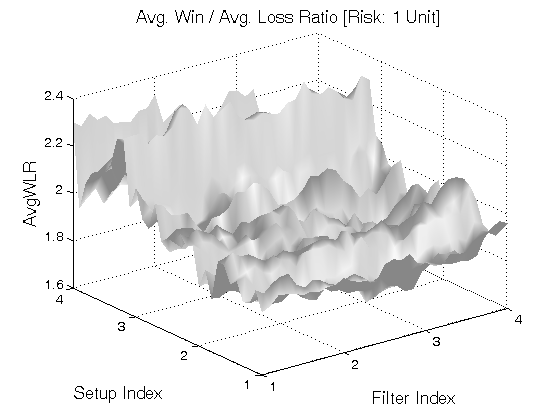
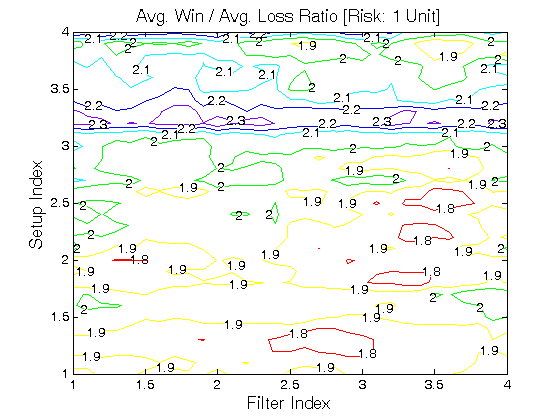
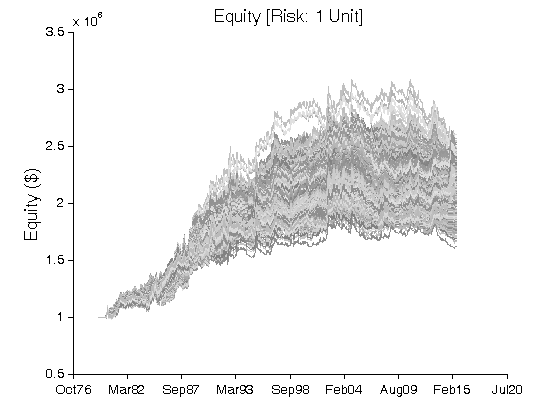
Figure 2 | Portfolio Performance (Inputs: Table 1; Commission & Slippage: $100 Round Turn).
IV. Benchmarking
We benchmark the currency model without the T-Bond filter (Base Case: The model without intermarket analysis) against the Pathfinder.
| Fixed Fractional Sizing | Base Case 1980-1995 | Pathfinder 1980-1995 | Base Case 1996-2015 | Pathfinder 1996-2015 |
| Net Profit ($) | 1,056,125 | 1,074,038 | 109,413 | 26,531 |
| Sortino Ratio | 1.29 | 1.42 | 0.29 | 0.10 |
| Sharpe Ratio | 0.79 | 0.88 | 0.17 | 0.06 |
| Sharpe Ratio (Semi-Deviation) | 1.27 | 1.39 | 0.29 | 0.10 |
| Ulcer Performance Index (UPI) | 1.19 | 1.31 | 0.13 | 0.02 |
| New High Ratio (%) | 5.72 | 5.92 | 1.67 | 1.61 |
| Profit Factor | 1.55 | 1.81 | 1.08 | 1.03 |
| CAGR (%) | 4.61 | 4.66 | 0.54 | 0.14 |
| Max. Drawdown (%) | (10.05) | (8.79) | (10.11) | (13.76) |
| Number of Trades | 842 | 629 | 998 | 743 |
| Percent Profitable Trades (%) | 42.64 | 46.58 | 37.37 | 36.07 |
| Avg. Win / Avg. Loss Ratio | 2.09 | 2.08 | 1.82 | 1.82 |
Table 2 | Benchmarking (Inputs: Table 1 Default Values; Fixed Fractional Sizing: 1%; Commission & Slippage: $100 Round Turn (RT)).
V. Rating: Intermarket Analysis: The Pathfinder | Trading Strategy
A/B/C/D
VI. Summary
(i) When we compare the Pathfinder trading strategy to the base case model (no T-Bond filter) during the initial period of 1980-1995 (Table 2), the performance is improved; (ii) During the period 1996-2015, the Pathfinder performs worse than the base case model.
Related Entries: Global Market Correlations: 1995-2014 (Data)
Related Topics: (Public) Trading Strategies
CFTC RULE 4.41: HYPOTHETICAL OR SIMULATED PERFORMANCE RESULTS HAVE CERTAIN LIMITATIONS. UNLIKE AN ACTUAL PERFORMANCE RECORD, SIMULATED RESULTS DO NOT REPRESENT ACTUAL TRADING. ALSO, SINCE THE TRADES HAVE NOT BEEN EXECUTED, THE RESULTS MAY HAVE UNDER-OR-OVER COMPENSATED FOR THE IMPACT, IF ANY, OF CERTAIN MARKET FACTORS, SUCH AS LACK OF LIQUIDITY. SIMULATED TRADING PROGRAMS IN GENERAL ARE ALSO SUBJECT TO THE FACT THAT THEY ARE DESIGNED WITH THE BENEFIT OF HINDSIGHT. NO REPRESENTATION IS BEING MADE THAT ANY ACCOUNT WILL OR IS LIKELY TO ACHIEVE PROFIT OR LOSSES SIMILAR TO THOSE SHOWN.
RISK DISCLOSURE: U.S. GOVERNMENT REQUIRED DISCLAIMER | CFTC RULE 4.41
Codes: matlab/freeburg/pathfinder/