R&D Blog
Four Problems with the Sharpe Ratio
The Sharpe Ratio, named after William Forsyth Sharpe, measures the excess return per unit of deviation in an investment asset or a trading strategy. There are the four potential problems in using the Sharpe Ratio to measure trading performance. The first two problems are relevant if trading results in different intervals are correlated, while the latter two problems are relevant even if trading results are uncorrelated.
Problem 1. Failure to distinguish between intermittent and consecutive losses (Figure 1): The risk measure in the Sharpe Ratio (the standard deviation) is independent of the order of various data points. Problem 2. Dependency on time interval: If trading results (in different time periods) are uncorrelated, in theory, the annualized Sharpe Ratio would be independent of the time interval length chosen for segmenting the data. However, the assumption that trading results are uncorrelated may not always be justified. Problem 3. Failure to distinguish between upside and downside fluctuations: The Sharpe Ratio is a measure of volatility, not risk. The two are not necessarily synonymous. In terms of the risk calculation employed in the Sharpe Ratio (i.e., the standard deviation of return) upside and downside fluctuations are considered equally bad. Thus, the Sharpe Ratio would penalize a system which exhibited sporadic sharp increases in equity, even if equity retracements were small. Problem 4. Failure to distinguish between retracements in unrealized profits versus retracements from “Trade Entry Date” equity. A “trade entry date” is defined as any day on which the net position shifts from neutral to long, neutral to short, long to short, or short to long. (Source: J. Schwager, A Complete Guide to the Futures Markets, 1984)
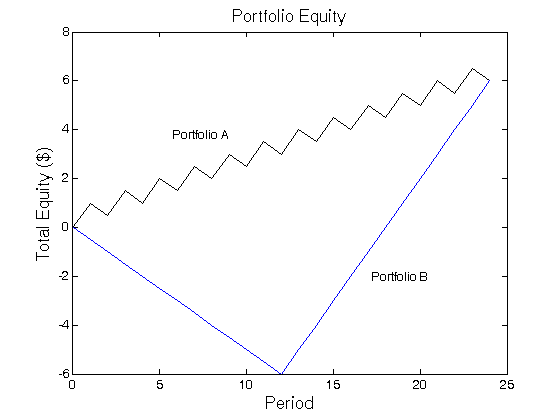
Figure 1 | Two portfolios with equal returns and standard deviations but different sequence of gains.