R&D Blog
Price Breakout with NR7 Pattern | Trading Strategy (Setup & Entry)
I. Trading Strategy
Developer: Toby Crabel (Setup: NR7 Pattern); Laurence A. Connors, Linda B. Raschke (Entry: Price Breakout with NR7). Source: (i) Crabel, T. (1990). Day Trading with Short Term Price Patterns and Opening Range Breakout. Greenville: Traders Press, Inc; (ii) Laurence A. Connors, Linda B. Raschke (1995). Street Smarts | High Probability Short Term Trading Strategies. M. Gordon Publishing Group, Inc. Concept: Volatility cycles. Research Goal: To study different price entry thresholds (i.e. “Channel_Length” var. defined in the Table 1). Specification: Table 1. Results: Figure 1-2. Trade Setup: The current daily range is narrower than the previous six days’ daily ranges compared individually. Trade Entry: Long Trades: A buy stop is placed one tick above the UpperChannel[Yesterday]. Short Trades: A sell stop is placed one tick below the LowerChannel[Yesterday]. Trade Exit: Table 1. Portfolio: 42 futures markets from four major market sectors (commodities, currencies, interest rates, and equity indexes). Data: 36 years since 1980. Testing Platform: MATLAB®.
II. Sensitivity Test
All 3-D charts are followed by 2-D contour charts for Profit Factor, Sharpe Ratio, Ulcer Performance Index, CAGR, Maximum Drawdown, Percent Profitable Trades, and Avg. Win / Avg. Loss Ratio. The final picture shows sensitivity of Equity Curve.
Tested Variables: Channel_Length & NR_Length (Definitions: Table 1):
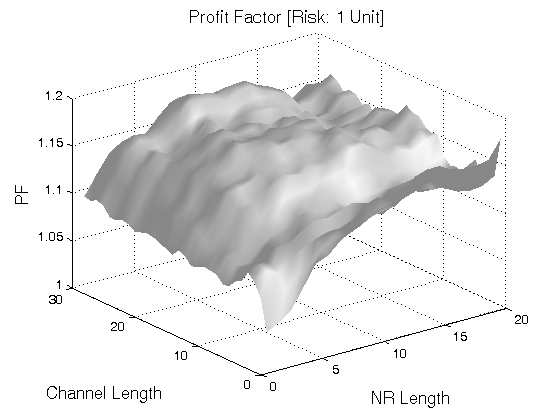
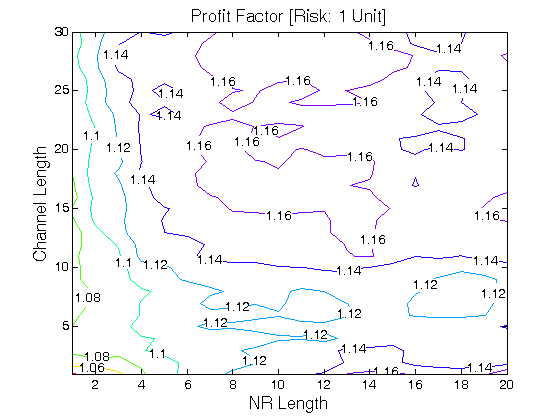
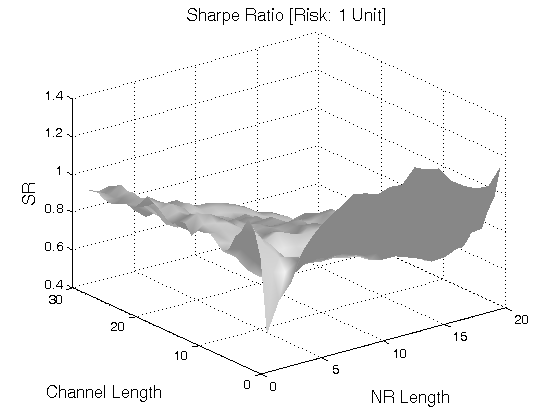
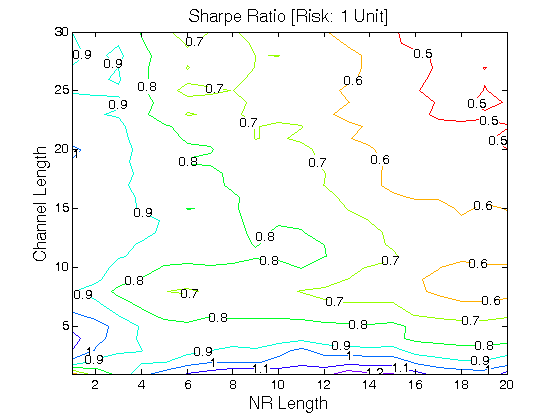
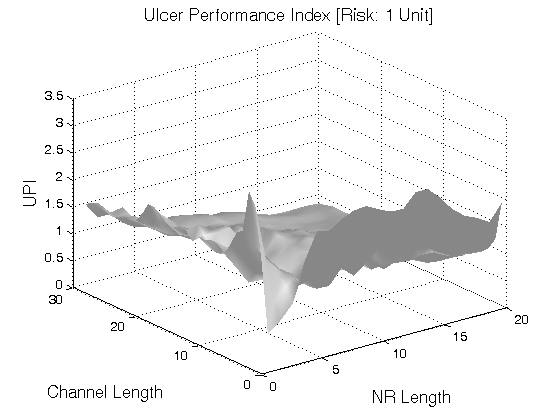
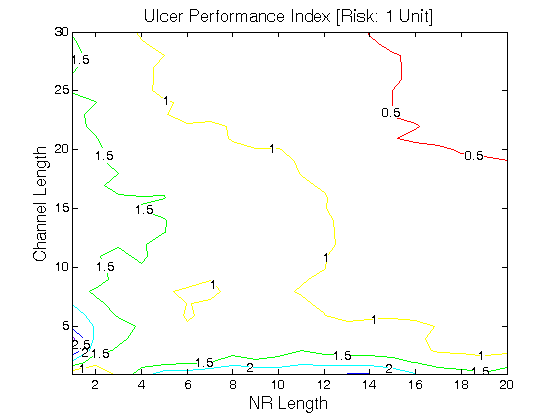


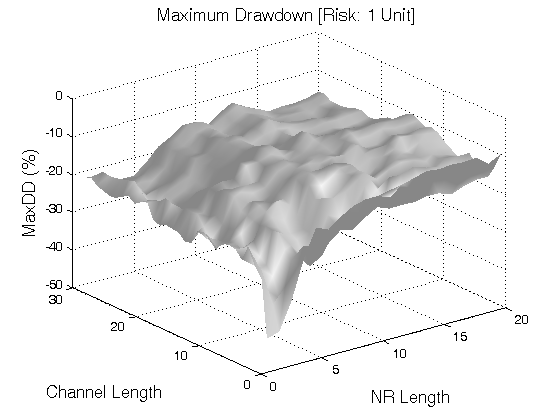
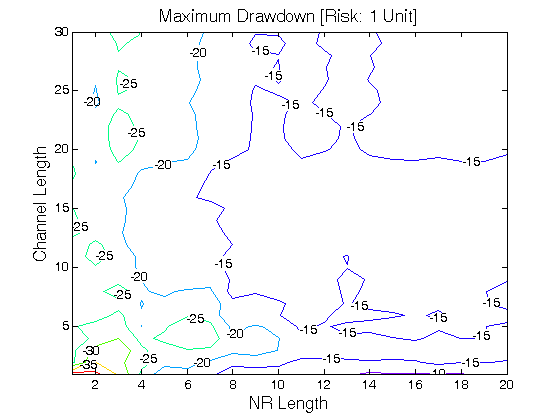

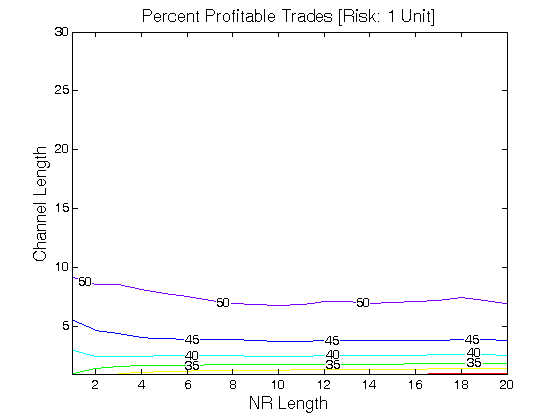
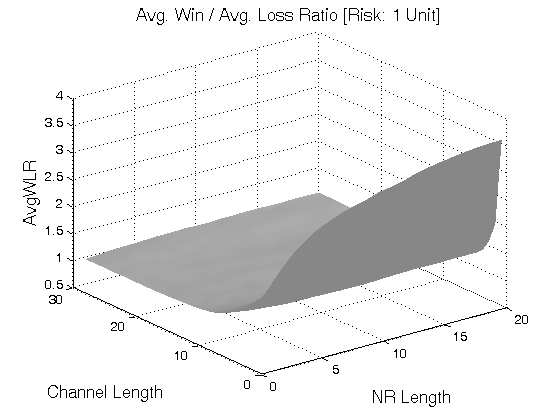

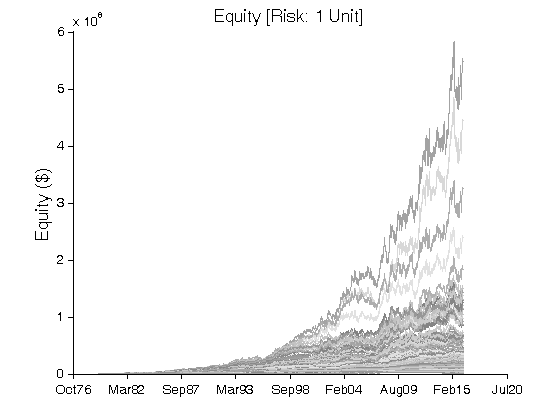
Figure 1 | Portfolio Performance (Inputs: Table 1; Commission & Slippage: $0).
| STRATEGY | SPECIFICATION | PARAMETERS |
| Auxiliary Variables: | UpperChannel(Channel_Length) is the highest high over a period of Channel_Length. LowerChannel(Channel_Length) is the lowest low over a period of Channel_Length. | Channel_Length = [1, 30], Step = 1; |
| Setup: | The current daily range is narrower than the previous six days’ daily ranges compared individually (NR_Length = 6; Default Value). | NR_Length = [1, 20], Step = 1; |
| Filter: | N/A | |
| Entry: | Long Trades: The next day after the setup, a buy stop is placed one tick above the UpperChannel[Yesterday]. Short Trades: The next day after the setup, a sell stop is placed one tick below the LowerChannel[Yesterday]. Note: The first stop that is traded is the position. The other stop is the protective stop. If both stops are triggered during the same day, we account only for one entry and one exit (no reversals) and assume the trade was a loser. | |
| Exit: | Time Exit: Nth day at the close. Stop Loss Exit: ATR(ATR_Length) is the Average True Range over a period of ATR_Length. ATR_Stop is a multiple of ATR(ATR_Length). Long Trades: A sell stop is placed at [Entry − ATR(ATR_Length) * ATR_Stop]. Short Trades: A buy stop is placed at [Entry + ATR(ATR_Length) * ATR_Stop]. | N = 10; ATR_Length = 20; ATR_Stop = 6; |
| Sensitivity Test: | Channel_Length = [1, 30], Step = 1 NR_Length = [1, 20], Step = 1 | |
| Position Sizing: | Initial_Capital = $1,000,000 Fixed_Fractional = 1% Portfolio = 42 US Futures ATR_Stop = 6 (ATR ~ Average True Range) ATR_Length = 20 | |
| Data: | 42 futures markets; 36 years (1980/01/01−2016/01/31) |
Table 1 | Specification: Trading Strategy.
III. Sensitivity Test with Commission & Slippage
Tested Variables: Channel_Length & NR_Length (Definitions: Table 1):
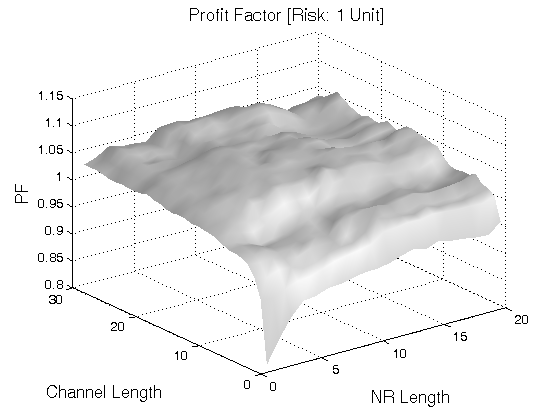
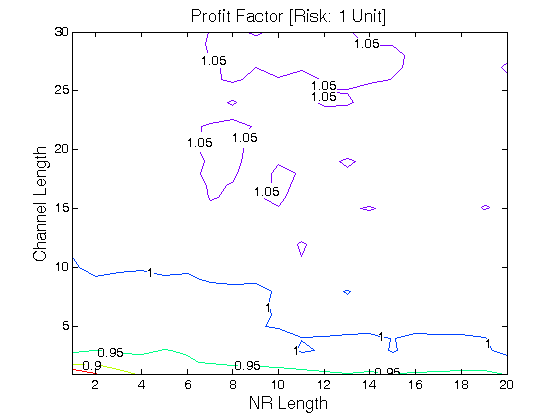
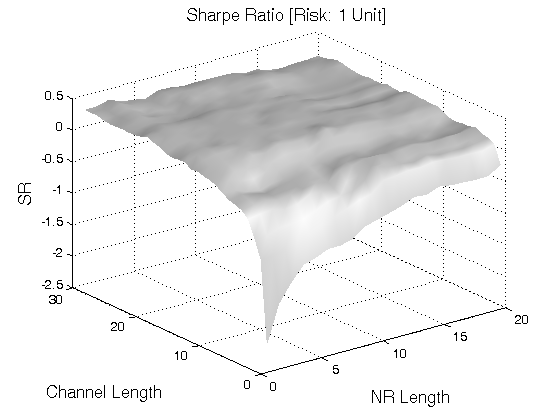
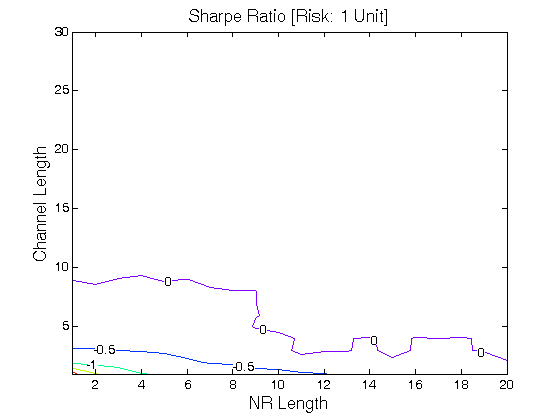

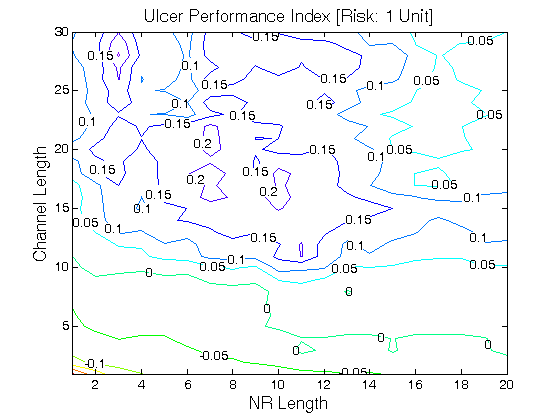
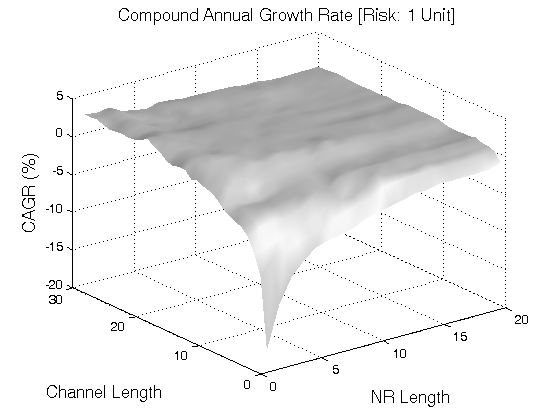
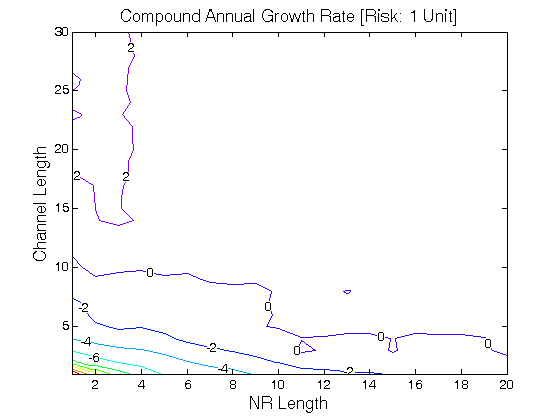
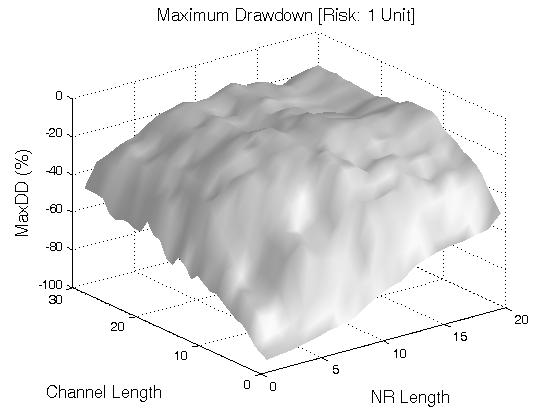
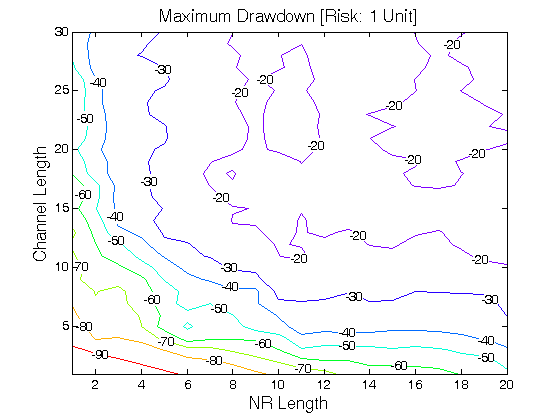

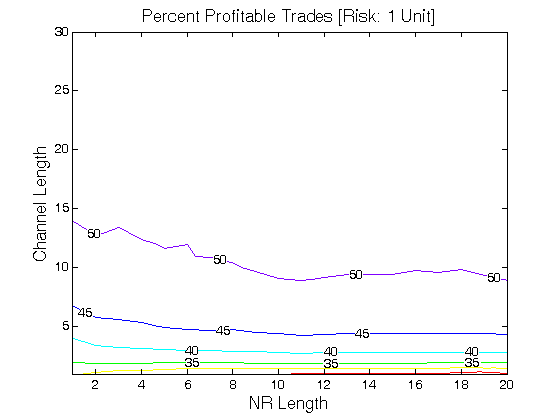
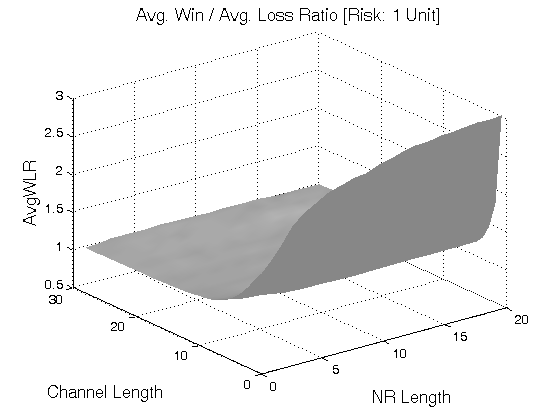

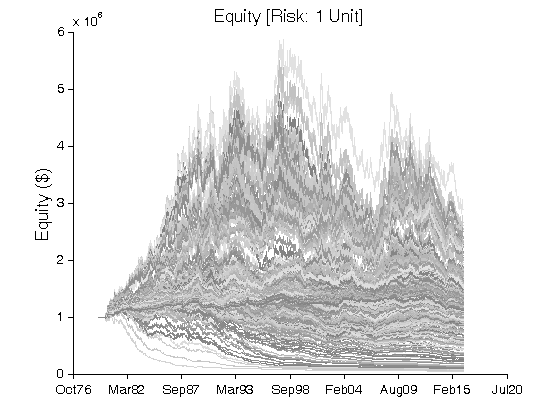
Figure 2 | Portfolio Performance (Inputs: Table 1; Commission & Slippage: $50 Round Turn).
IV. Rating: Price Breakout with NR7 Pattern | Trading Strategy
A/B/C/D
V. Summary
(i) The NR7 pattern performs better when NR_Length ≥ 6 (Figure 1-2); (ii) Once the cost of trading is applied (Figure 2), the pattern is not currently tradeable without some additional rules; (iii) The NR7 pattern with price breakout performs better when Channel_Length ≥ 10 (Figure 2).
Related Entries: Price Breakout with NR7 Pattern (Setup & Exit) | NR7 Pattern (Setup & Exit)
Related Topics: (Public) Trading Strategies
CFTC RULE 4.41: HYPOTHETICAL OR SIMULATED PERFORMANCE RESULTS HAVE CERTAIN LIMITATIONS. UNLIKE AN ACTUAL PERFORMANCE RECORD, SIMULATED RESULTS DO NOT REPRESENT ACTUAL TRADING. ALSO, SINCE THE TRADES HAVE NOT BEEN EXECUTED, THE RESULTS MAY HAVE UNDER-OR-OVER COMPENSATED FOR THE IMPACT, IF ANY, OF CERTAIN MARKET FACTORS, SUCH AS LACK OF LIQUIDITY. SIMULATED TRADING PROGRAMS IN GENERAL ARE ALSO SUBJECT TO THE FACT THAT THEY ARE DESIGNED WITH THE BENEFIT OF HINDSIGHT. NO REPRESENTATION IS BEING MADE THAT ANY ACCOUNT WILL OR IS LIKELY TO ACHIEVE PROFIT OR LOSSES SIMILAR TO THOSE SHOWN.
RISK DISCLOSURE: U.S. GOVERNMENT REQUIRED DISCLAIMER | CFTC RULE 4.41
Codes: matlab/crabel/nr7-price-breakout/